Dark Winter
 In his book “Dark Winter, How the Sun Is Causing a 30-Year Cold Spell,”1 John L. Casey outlines a distinctively different interpretation of so-called ‘global warming.’ Casey makes the claim that, in 2007, he announced to the world, to those who would listen anyway, that the Earth would from that time on undergo a massive cooling period, which would last for about 30 years.
Casey developed his theory around what he calls solar hibernation. This is an expression to describe the state of the Sun when it exhibits a long period of low sunspot number. That is called solar minimum by the space science community.
Casey documents a theory that the Sun is absolutely the main driving force for Earth weather. Solar irradiance is the energy flux experienced at the Earth, and human kind cannot do anything about it.
There are many websites, both for and against anthropogenic global warming, now called ‘climate change’ but Casey’s theory is different. He is not the only engineer or scientist to notice a correlation between sunspot activity and global temperatures, but he adds 32 other physical reasons (lines of evidence) that corroborate his theory, in Appendix 3 titled: “Press Release: Global Warming Has Ended; the Next Climate Change Has Begun.”
I have not yet personally taken a firm position on these lines of evidence, but if what he writes is correct, at a minimum, it could be said that the scientific data is equivocal at best. It may even predict what he claims it does, but it seems to me that with human lifetimes only of order 50-100 years and the lack of more than 100 years of any real temperature data, it is difficult to draw firm conclusions at this time.
But in the interest of open communication of science of what has become almost irrational modern-day discussion—almost with religious fervor—I feel compelled to share my assessment.
Casey’s Relational Cycle theory is developed from the Earth’s weather’s relationship to the primary 206-year period, and other characteristic periods, of sunspot activity. He claims his theory, in April/May 2007, predicted:
- The end of global warming;
- Solar hibernation – a historical reduction in the energy output of the Sun that occurs every 206 years;
- A long-term drop in the Earth’s average temperature;
- The advent of the next climate change, predicting 20 to 30 years of deep and dangerous cold weather.
Associated with the general global cooling over the next two decades, according to Casey, not only are the governments failing to prepare to mitigate the effects, through technology and planning, but also they are failing to recognize other potential impacts. One of those is an increase in large devastating earthquakes, caused by the contraction of the crust. I don’t know enough about geophysics to comment on that, but I decided I would look at the sunspot and global temperature data myself to see what conclusions, if any, I could make.
My own analysis
We are currently entering solar cycle number 24. They have been counted since Galileo but numbered since about 1740. This is shown in Fig. 1 of sunspot number verses year, since 1700. Each peak there is the maximum in sunspots during the regular 11-year cycle.
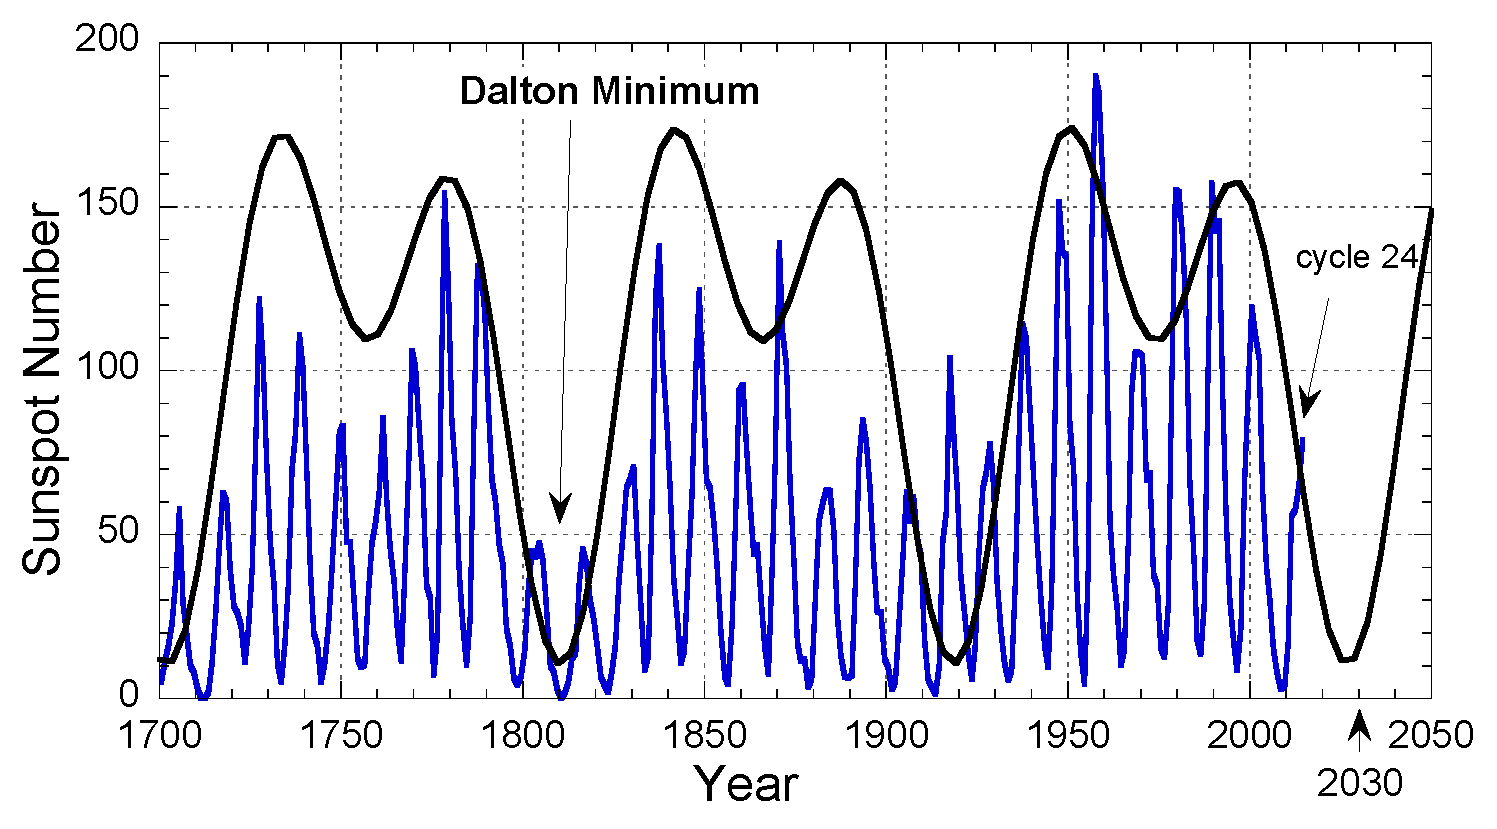
So without taking into account any other priors, the fit I show (thick black line) gives a reasonable fit except near 1900, though the reduce trend is still evident.
The Dalton Minimum2 was famously a period where the Earth experienced bitterly cold weather. The minimum indicated prior to 1700, called the Maunder Minimum3 was a period of almost no sunspots starting in about 1645 and continuing to about 1715. In Europe the temperatures were described as being much lower than average during that period.
Now Casey’s prediction is that the number of sunspots will only reach 74, 50 and 50 for cycles 24, 25 and 26 respectively. Hence around 2013 this minimum activity is predicted to mean lower solar irradiance and hence colder global temperatures.

In Fig. 2 shows the change in global temperature derived from the only actual globally measured surface air temperature data for our planet. All other data shown over longer timescales are extracted from proxies that are meant to represent temperature.
Here a fifth-order polynomial has been fitted to the data. The fitted function does show a global warming trend between 1970 and about 2000, a global cooling trend between 1940 and 1970 and a slight cooling trend beyond 2000.
The lower temperatures around 1914 are consistent with lower sunspot number during that period but of course the data is lacking anything definitive.
But can we extrapolate the trend of reducing sunspot number, via solar irradiance, to a prediction of a strong cooling trend over the next 20 years? That is a very good question. Normally in physics, it is dangerous (in the sense of confidence in the prediction) to extrapolate your trend line beyond a very small percentage.
If the system is highly non-linear and or you don’t have a robust model to describe the subject under investigation, in this case the Earth’s temperatures, any extrapolation may be fraught with error.
If however the sunspots are an indication then we would expect to see global temperature decrease on average by about 0.5 degrees Celsius. That would be consistent with the cold period around hundred years ago.
Conclusion
The only conclusion one can definitively draw from this is that global temperatures have not been rising for the past 16 years. If Casey is correct, we will experience a few decades of very cold weather. In 30 years we will have a definitive answer to whether he was right.
The problem with these types of measurements, like any measurement that tries to re-construct the past history of our planet, the solar system, the Galaxy or the Universe as a whole, is that we have too little data, which we can really rely upon.
To really know what happened in the past you need eye-witnesses. Eye-witnesses have described the bitterly cold periods of the Maunder Minimum and the Dalton Minimum. But no one alive today observed the last ice-age. To construct a timeline for that many assumptions—unprovable assumptions—must be made.
This is the fundamental weakness of reconstructing the events of the past. The evidence is all circumstantial. Just look at the problem the earth scientists have, when they try to calculate the age of the Earth. They must rely on unprovable assumptions. But no human witnessed the creation—even Adam missed it—so we must rely on what God has revealed to us.
This is what makes this type of science—historical science—so weak. The best source of knowledge is a written history. Though the Bible does not speak of global warming, nor even an ice-age after the earth-covering flood in Noah’s day, some inferences may be obtained from it.
But the Bible does not speak of multiple ice ages, and billions of years of history. Yet strangely enough, those who would deny the historicity of the Bible appear to be those who present the most rational arguments in the current anthropogenic global warming debate. Based on their belief of past natural global warming and cooling periods due to the Earth’s motion around the Sun, they argue whatever is happening now is unremarkable. No human contribution is significant.
Well, you be the judge! In my opinion, the data, currently, do not strongly favour global warming of any kind.
References
- J.L. Casey, Dark Winter, How the Sun Is Causing a 30-Year Cold Spell, Humanix Books, Boca Raton, FL, USA, 2014.
- Dalton Minimum, Wikipedia
- Maunder Minimum, Wikipedia
Related Reading
- GLOBAL COOLING ALARMISTS 40 YEARS AGO
- GLOBAL COOLING COMING
- THE PAUSE CONTINUES
- BIG SCIENTIFIC LIES THAT HAVE BEEN TOLD


